[Scroll]
Interactive Data Visualisation · Collaboration · 2025
Algorithmic Arts
Algorithmic Arts turns 24 years of European drought data into a living artwork you play with your hands. Each country is a shape that drifts and bounces across the screen, sized by how much of its land dried out.
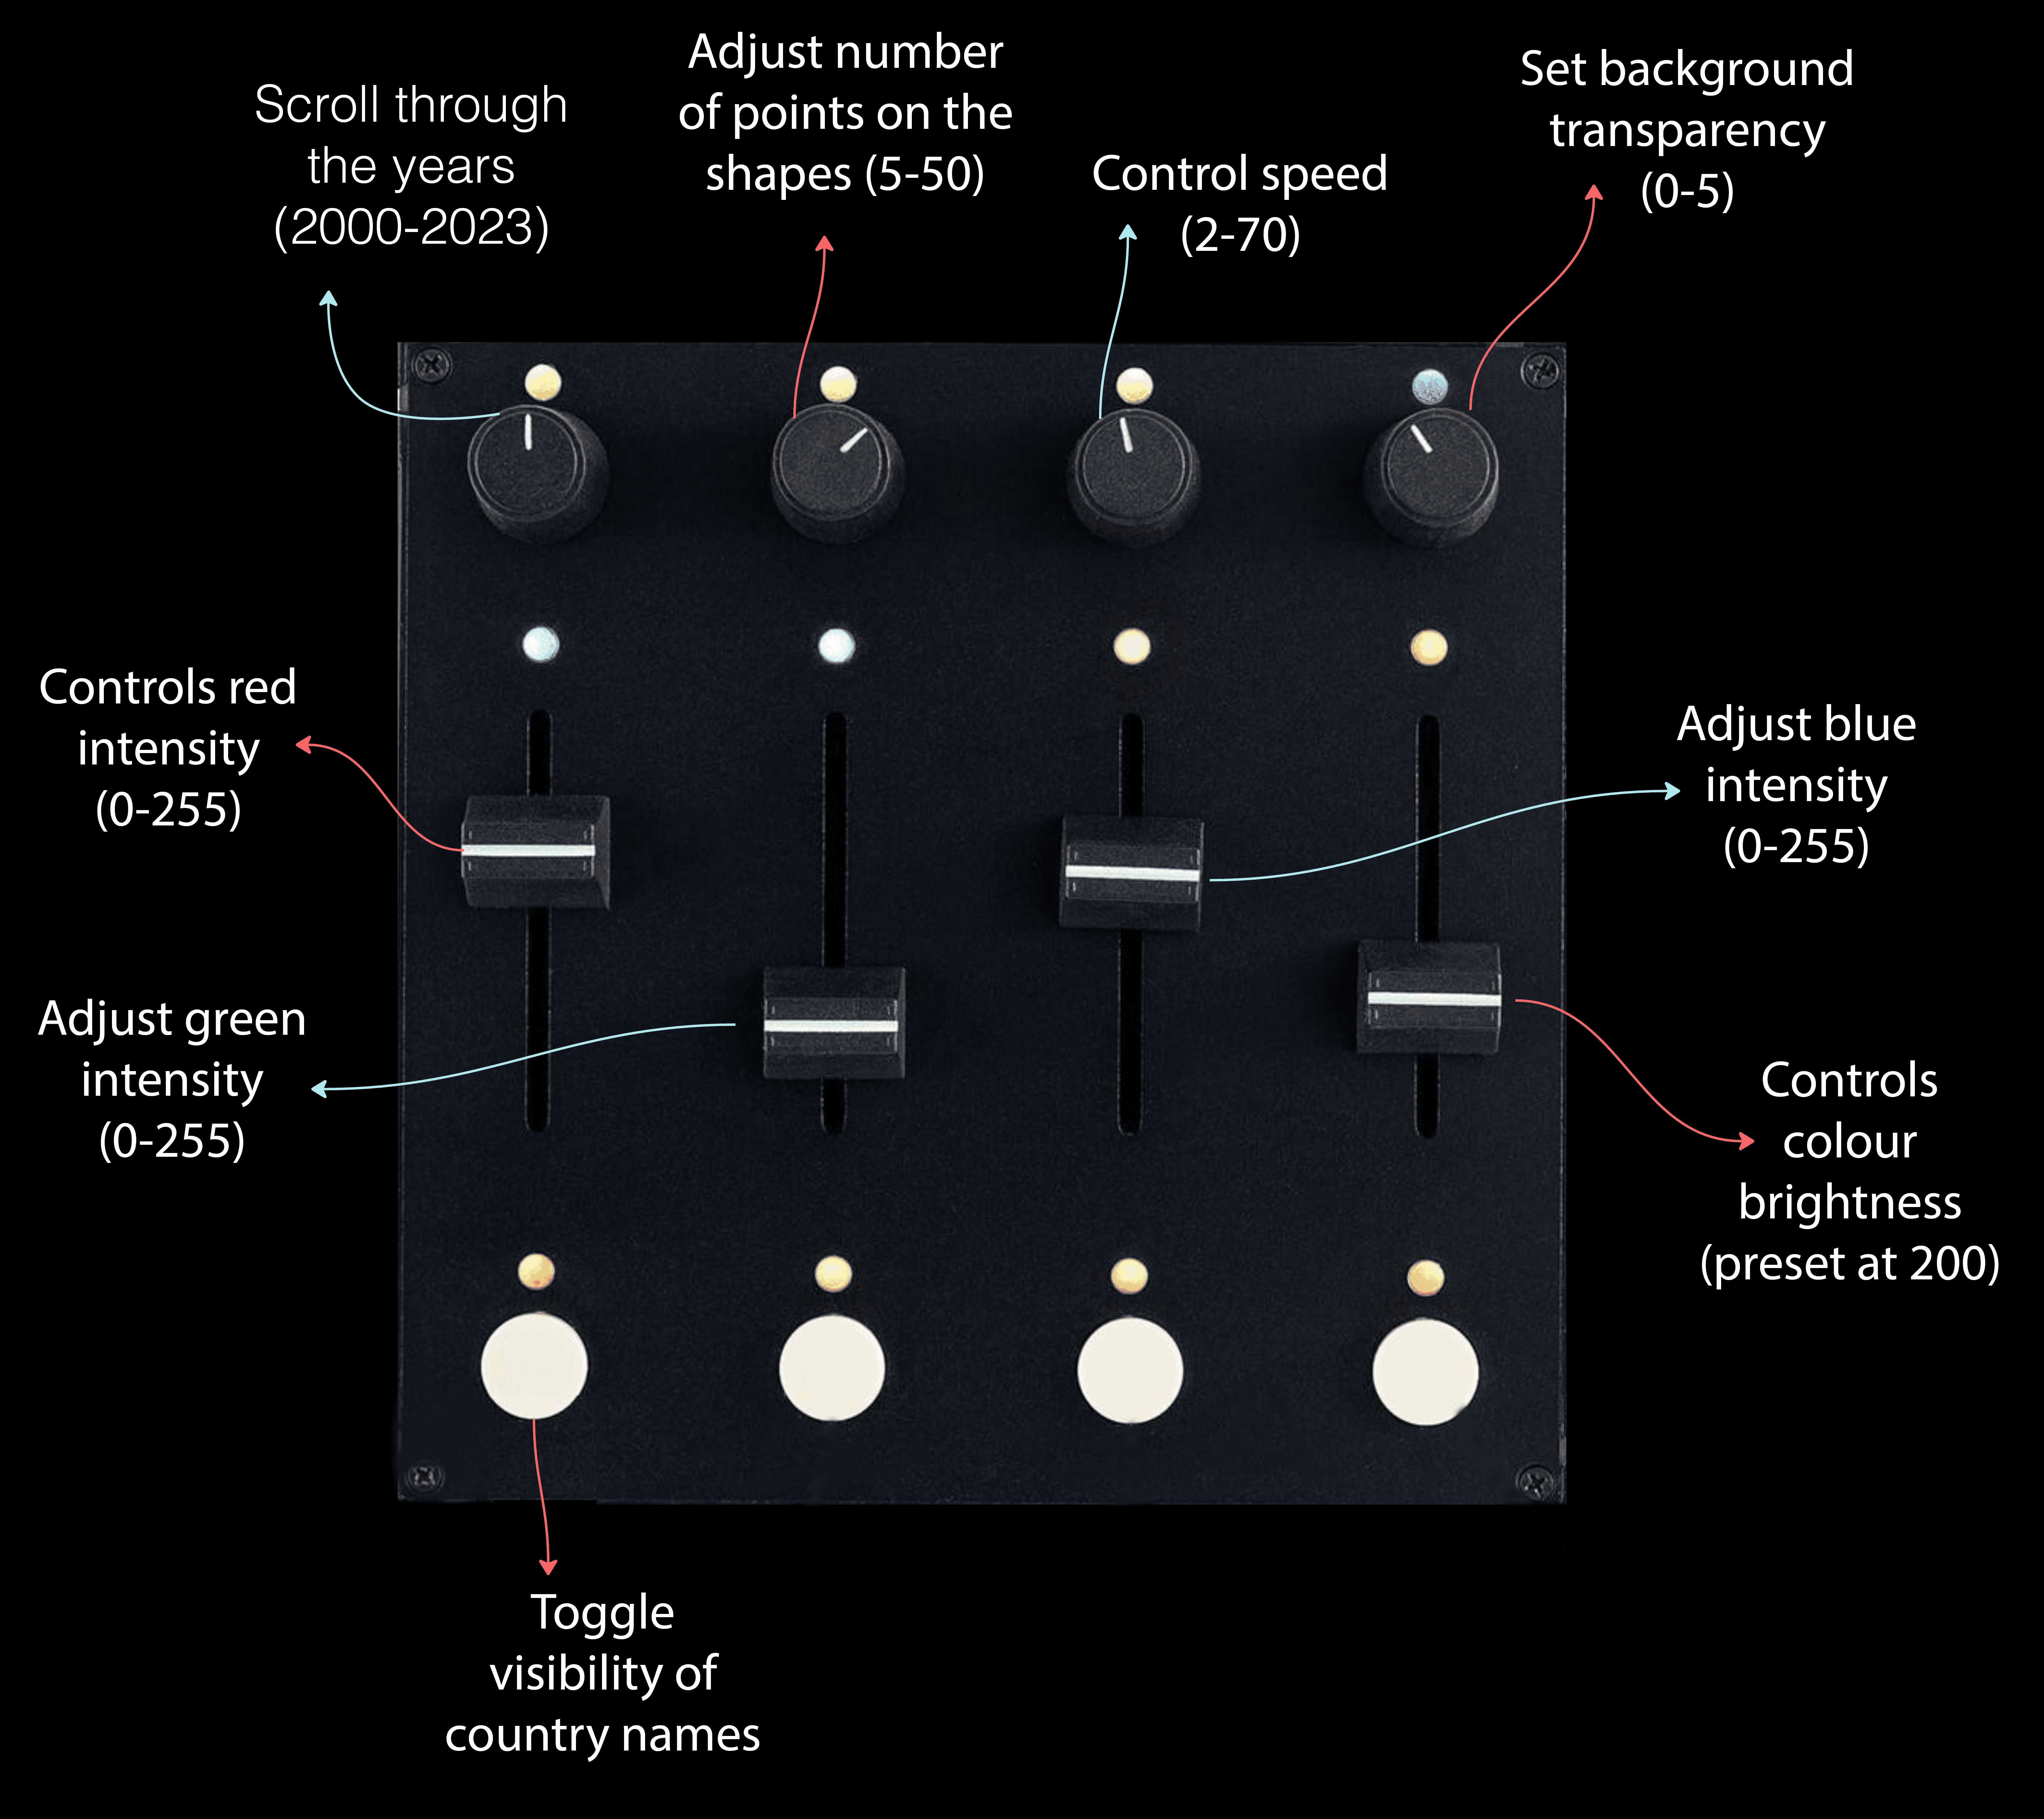
Built in p5.js by a team of three, it’s controlled by a MIDI deck of knobs and sliders. I led the design and the interactions: what every control does and why. It went on show in a 360° LED room at the university’s Immersive Visualisation and Simulation Lab (IVSL).
- Tools
- p5.js
JavaScript
Webmidi.js
MIDI controller - Year
- 2025
- Services
- Data visualisation
Creative coding
Interaction design
Prototyping

Data you can interact with.
I started with a list of more than a dozen ideas and cut it down to the controls that change how the data feels: one knob scrubs through the years, others shift speed, colour and trails. We left three buttons blank on purpose, because more controls would have been noise. Quality over quantity.


Played by the public
After the IVSL, the project went on to feature at NUA events for the Creative Technology courses. As a student ambassador, I also presented it at the Norwich Science Festival at The Forum, where the public took over the MIDI controls. Our team’s project was highlighted at the event: kids loved switching colours and modes, and parents loved that they were learning while they played.

Data Visualisation · Collaboration · 2025
Algorithmic Arts
Algorithmic Arts turns 24 years of European drought data into a living artwork you play with your hands. Each country is a shape that drifts and bounces across the screen, sized by how much of its land dried out.
Built in p5.js by a team of three, it’s controlled by a MIDI deck of knobs and sliders. I led the design and the interactions: what every control does and why. It went on show in a 360° LED room at the university’s Immersive Visualisation and Simulation Lab (IVSL).
- Tools
- p5.js
JavaScript
Webmidi.js
MIDI controller - Year
- 2025
- Services
- Data visualisation
Creative coding
Interaction design
Prototyping
Data you can interact with.
I started with a list of more than a dozen ideas and cut it down to the controls that change how the data feels: one knob scrubs through the years, others shift speed, colour and trails. We left three buttons blank on purpose, because more controls would have been noise. Quality over quantity.
Played by the public
After the IVSL, the project went on to feature at NUA events for the Creative Technology courses. As a student ambassador, I also presented it at the Norwich Science Festival at The Forum, where the public took over the MIDI controls. Our team’s project was highlighted at the event: kids loved switching colours and modes, and parents loved that they were learning while they played.